

My Business Intelligence Internship: From Excel Data to Power BI
Introduction
When I started my internship as a Business Intelligence (BI) Analyst Intern at CG United Insurance Ltd, I was excited to finally see what working with data looked like outside of a university classroom.
As a Mathematics and Statistics student, most of my experience with data had been academic. I had worked with statistical models, programming, and structured datasets, but I hadn’t yet had to take a real business problem, figure out what the data could actually tell me, and communicate those findings to the people making decisions.
That turned out to be one of the biggest lessons of the internship.
From spreadsheets to a data model
One of the main projects I worked on involved using geographic and operational data to better understand the company’s business across different areas.
The starting point was not some beautifully structured database. It was several Excel datasets containing information about things such as customers, risks, and claims.
My first challenge was therefore not visualization; it was getting the data into a form that could actually be analyzed.
I spent a significant amount of time cleaning and preparing the different datasets before bringing them into Power BI. From there, I built a star schema using Power Query and DAX, connecting the different pieces of information into a structure that could support the analysis.
This was probably one of the more challenging technical parts of the internship. I had to learn not only how to build the model, but also how to build it in a way that matched the requirements and expectations of the business.
There were definitely moments where getting the star schema was frustrating. But that experience taught me something that isn’t always obvious in a classroom: there isn’t always one “correct” way to structure a solution.
Sometimes the challenge is understanding what the end user actually needs.
The map that didn’t quite become a map
One of the original ideas for the project was to use geographic information to visualize where customers and other activity were concentrated.
I initially explored the possibility of mapping the data using latitude and longitude. However, the geographic information available to us ultimately wasn’t detailed enough for that approach. The most reliable geographic level we could work with was the town.
Rather than forcing a more precise map that the data couldn’t support, we adapted the approach and used heat maps instead.
That was another useful lesson: sometimes the best analytical solution isn’t the most technically sophisticated one ; It’s the one that makes the most sense given the quality and limitations of the data.
And that became a recurring theme throughout the project.
Building the final report
Once the data had been cleaned, modelled, and prepared, I built the final Power BI report from scratch.
This was probably my biggest achievement during the internship.
I started with a handful of Excel sheets and had to work through the entire process: cleaning the data, designing the data model, deciding what information was useful, building the visualizations, and eventually turning all of that into a report that could communicate something meaningful.
The end product wasn’t just an exercise in making charts look good. The goal was to use the data to identify areas where the business might need to pay attention.
What I found most rewarding was seeing the analysis move beyond the screen.
It wasn’t just “here’s an interesting pattern in the data.” It became “here’s something the organization might want to investigate further.”
From analysis to presentation
After completing the report, I created a PowerPoint presentation summarizing my findings and presented it to approximately 30–35 people, including management and employees.
Presenting to people who actually work with the business was a very different experience from presenting an assignment in a university course.
In university, you generally know the question you’re answering and the person evaluating your work. In a business setting, the audience can have very different perspectives and levels of familiarity with the analysis.
That forced me to think more carefully about how to communicate the analysis, rather than simply doing the analysis.
Unfortunately, I wasn’t able to keep the actual report content because of the confidential nature of the work, but I was able to keep the cover slide from the presentation at the beginning of this post.
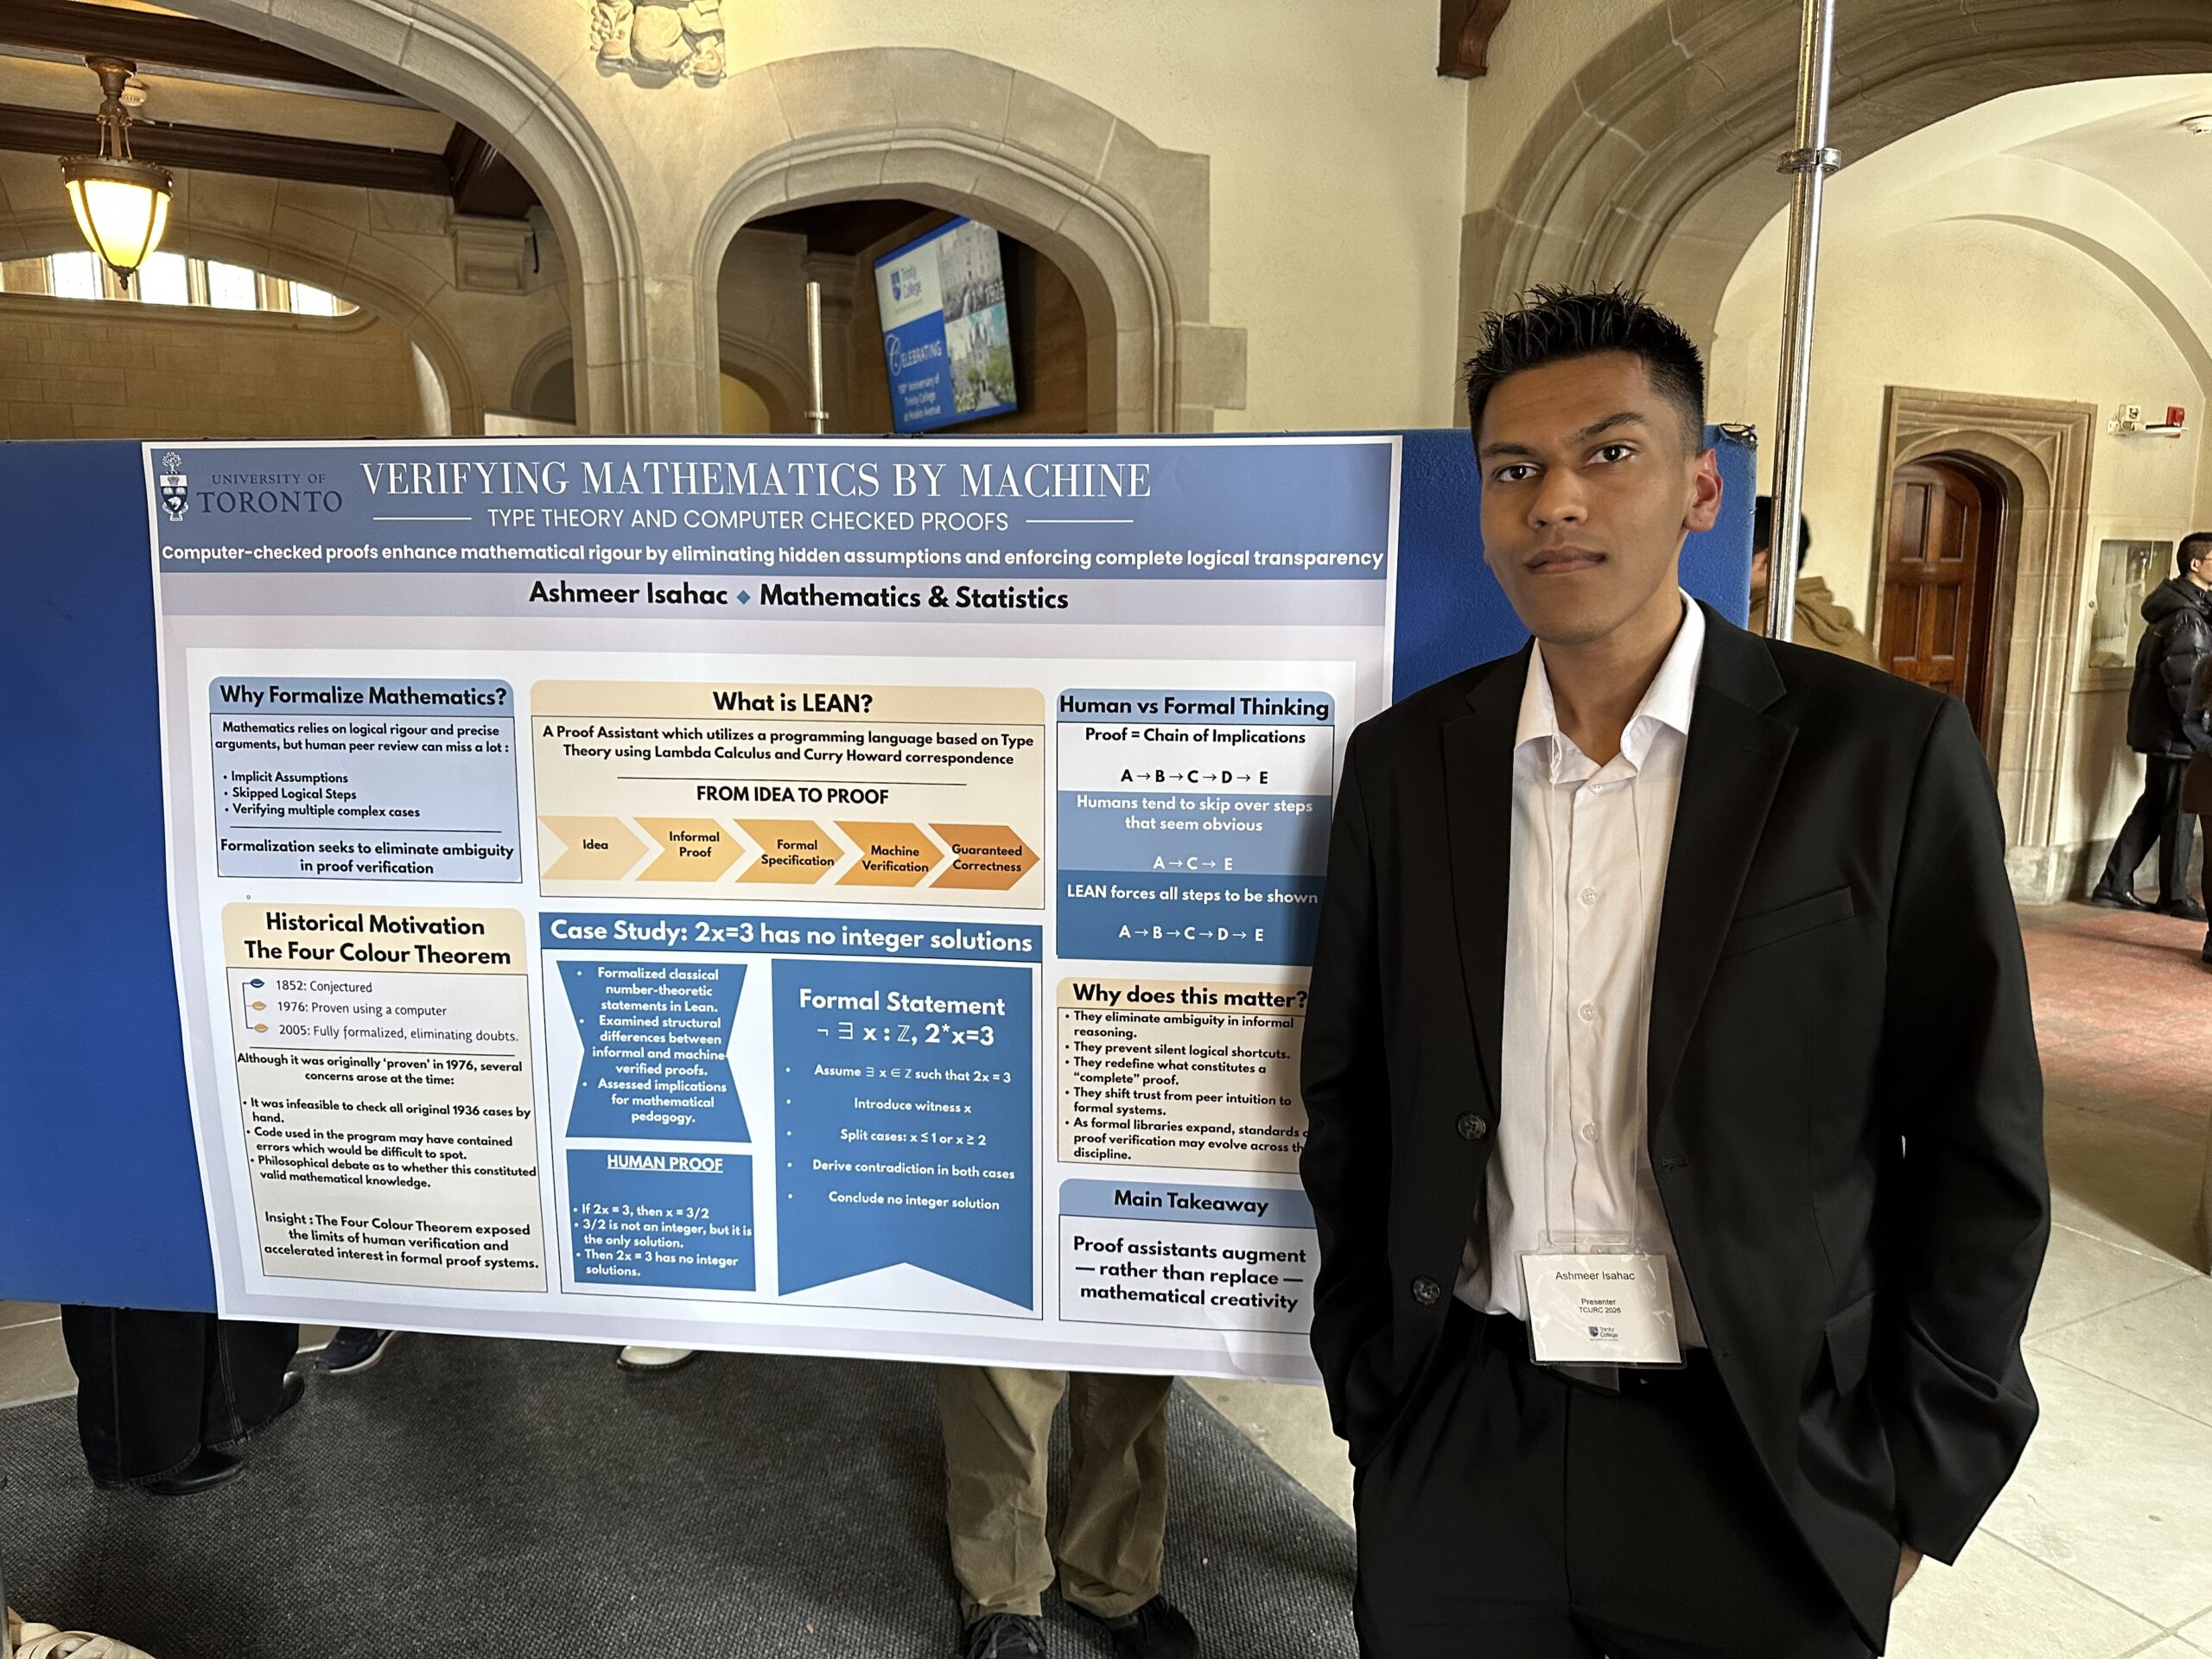
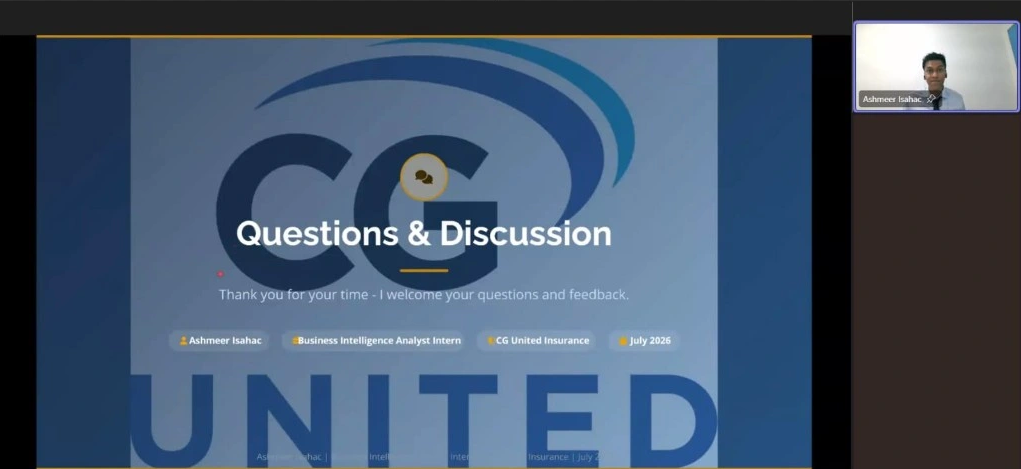
Also, here’s an awkward picture of my from my Q&A session at the end.
The “customer of the future”
The internship also included a group project involving all of the interns.
We were challenged with designing something that could help brokers and intermediaries better serve the “customer of the future.”
Our group developed a mockup of a broker portal using Figma. We then created a recorded demonstration showing how the portal could work and presented the concept to management and executives.
My contribution included doing the voiceover for the demo, which was probably one of the more character-building experiences of the internship.
Let’s just say that hearing yourself repeatedly while editing a voiceover is a very effective way to discover how much you dislike the sound of your own voice.
But jokes aside, this project gave me exposure to a completely different side of working in business technology.
Unlike the BI project, this wasn’t primarily about analyzing existing data. It was about identifying a problem, thinking about the user’s needs, designing a potential solution, and communicating that idea effectively.
It was a good reminder that technology and analytics aren’t just about the tools themselves. They’re ultimately about people and the problems we’re trying to solve for them.
What I learned
Looking back, the technical skills were obviously a major part of the internship. I became much more comfortable working with Power BI, Power Query, DAX, data modelling, and data visualization.
But I think the lessons I’ll carry forward are broader.
1. Real-world data is messy.
University datasets tend to arrive in a form that’s ready to analyze. Real-world data doesn’t always cooperate.
Missing information, inconsistent formats, limited geographic detail, and questions about how data is collected can all affect what analysis is possible.
I learned that understanding the limitations of your data is just as important as understanding the analysis itself.
2. The most complicated part isn’t always the code.
Sometimes the hardest part is figuring out what the business actually needs.
Building a technically impressive dashboard doesn’t matter much if it doesn’t answer a useful question or help someone make a decision.
3. Communication is part of analytics.
Being able to build a report is one skill.
Being able to stand in front of 30–35 people and explain what that report means is another.
The internship made me appreciate that communication isn’t something that happens after the analytical work. It’s part of the analytical work.
4. Starting from almost nothing can be incredibly rewarding.
Perhaps the thing I’m proudest of is the transformation from a few Excel sheets to a complete analytical report.
Seeing that progression made the internship feel very tangible. I could look at the final product and know that I had built it from the ground up.
Looking ahead
Overall, my BI internship was a great experience.
It gave me the opportunity to take concepts that I had primarily encountered through mathematics and statistics courses and see how they could be applied in an actual organization.
More importantly, it gave me a much clearer idea of the kind of work I enjoy.
I like taking messy information, figuring out what it can tell us, building something useful from it, and then communicating that result to other people.
That’s something I’d definitely like to explore further as I finish my degree and begin thinking about what comes next.
I’m leaving the BI internship with more technical skills, more confidence, and, perhaps most importantly, a better understanding of what it means to work with data in the real world.
And I think that’s a pretty good outcome for a first internship.